https://leafletjs.cn/examples/quick-start/
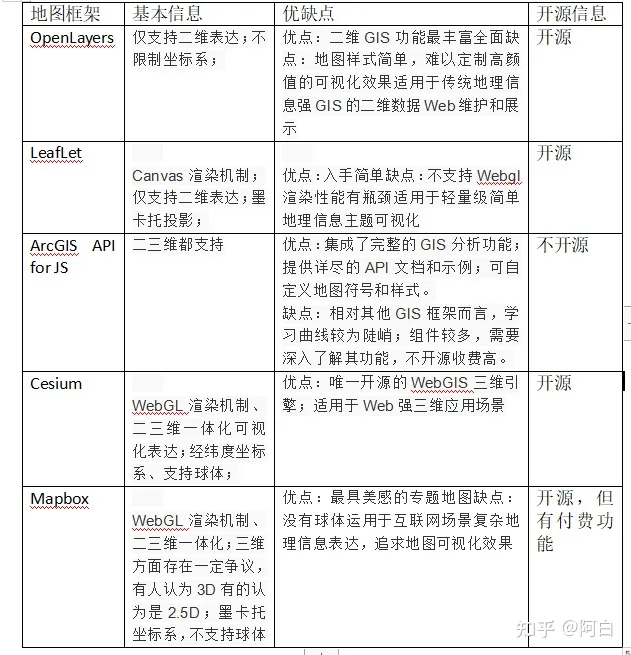
- WebGIS五种框架对比
qgis
- QMetaTiles插件
- 瓦片
const initMap = () => {
  const imagesLayer = L.tileLayer(`https://tiles1.geovisearth.com/base/v1/img/{z}/{x}/{y}?token=${geovisearthToken}`);
  const imagesLableLayer = L.tileLayer(`https://tiles1.geovisearth.com/base/v1/cia/{z}/{x}/{y}?token=${geovisearthToken}`);
  const layers = L.layerGroup([imagesLayer, imagesLableLayer])
  map = L.map('myMap', {  //需绑定地图容器div的id
    center: [25.67052, 121.99804], //初始地图中心
    zoom: 12, //初始缩放等级
    maxZoom: 20,
    minZoom: 2,
    zoomControl: true, //缩放组件
    attributionControl: false, //去掉右下角logol
    scrollWheelZoom: true, //默认开启鼠标滚轮缩放
    // 限制显示地理范围
    maxBounds: L.latLngBounds(L.latLng(-90, -180), L.latLng(90, 180)),
    layers: [layers] , // 图层

     crs: L.CRS.EPSG4326,
        layers: [layer1, layer2,],
        zoomControl: false, // 禁用 + - 按钮
        doubleClickZoom: false, // 禁用双击放大
        attributionControl: false // 移除右下角leaflet标识
  })
  // 添加比例尺要素显示
  L.control.scale({ maxWidth: 200, metric: true, imperial: false }).addTo(map)
  /** 地图聚合 */
  addMapFeature(pointData);
}


 // 地图聚合
const addMapFeature = (pointData) => {
  // 创建新的聚合图层,向其添加标记,然后将其添加到地图中
  const projectPointLayer = L.markerClusterGroup({
    showCoverageOnHover: false, // 为true时,当鼠标悬停在聚合点上时,它会显示它聚合的边界
    zoomToBoundsOnClick: true, //  为true时,当鼠标点击某个聚合点时,会缩放到它的边界范围
    chunkedLoading: true,
    spiderfyOnMaxZoom: true,
    maxClusterRadius: 80, // 聚类从中心标记覆盖的最大半径(以像素为单位),默认值 80
    spiderLegPolylineOptions: { weight: 1, color: '#222', opacity: 0.5 },
  }).addTo(map);
  let geojson = pointData;
  if (geojson) {
    addProjectClusterLayers(geojson, projectPointLayer);
    projectPointLayer.on("click", function (e) {
      e.layer.unbindPopup(); // 用于解除地图图层(layer)与其关联的弹出窗口(popup)
      // 图层点击弹出窗口处理事件
      const elements = getProjectPopupContent(e.layer.options.properties); // 返回内容
      e.layer.bindPopup(elements).openPopup(e.latlng); // 弹窗
    });
  }
};

/*
 * 点单击内容函数
 */
const getProjectPopupContent = (item) => {
  // 内容及单击事件
  const elements = `<div>${toPopupItemStr("经度", item.lon)} ${toPopupItemStr("纬度", item.lat)} ${toPopupItemStr("阈值", item.valve)}</div>`;
  return elements;
};
const toPopupItemStr = (name, value) => {
  return value ? `<b>${name}:</b>${value}<br>` : "";
};

/*
 * 加载聚合图层
 */
const addProjectClusterLayers = async (geojson, clusterlayer) => {
  let markerList = []; // 聚合标记点列表
  if (geojson.features.length > 0) {
    for (let i = 0; i < geojson.features.length; i++) {
      if (geojson.features[i].geometry) {
        const properties = geojson.features[i].properties;
        const coordinate = geojson.features[i].geometry.coordinates;
        /*  点状展示样式(无聚合状态) */
        let img = dot3Url;
        const myIcon = L.icon({
          iconUrl: img,
          iconSize: [25, 25],
        });
        const marker = L.marker(new L.LatLng(coordinate[1], coordinate[0]), {
          properties: properties,
          icon: myIcon,
        });
        markerList.push(marker);
      }
    }

  }
  clusterlayer.addLayers(markerList);
};
OpenLayers
OpenLayers是一款功能强大、灵活的开源JavaScript库,适用于桌面和移动设备。
优点:OpenLayers性能好,可以支持超大数据量点位叠加,并对于各种地图服务支持较好。比如WMS、WFS。插件生态也比较完善比较容易扩展。
缺点:API文档比较复杂,学习成本较大。试用范围
LeafLet
LeafLet是最著名的前端地图可视化库,它开源、体积小、结构清晰、简单易用,拥有大量的插件。
优点:简单易上手,轻量级。
缺点:在处理大规模数据时可能会出现性能瓶颈。
ArcGIS API for JS
ArcGIS API for JS 是较为学院派的前端地图库,它是ArcGIS开发套件中的一部分,和桌面端和服务器端ArcGIS软件有较好的协作。它不开源且收费不低,在学术场景下较为常用。
优点:集成了完整的GIS分析功能;提供详尽的API文档和示例;可自定义地图符号和样式。
缺点:相对其他GIS框架而言,学习曲线较为陡峭;组件较多,需要深入了解其功能,不开源收费高。
Cesium
Cesium是一款基于WebGL的三维地球开发框架,提供了丰富的三维地球展示和空间分析功能。
优点:支持三维场景的地图,提供大量的GIS数据可视化功能;开发文档十分详细。
缺点:学习成本高,需要理解3D场景的概念;在加载大量数据时,性能不是特别好,本身不支持加载矢量切片图层。
Mapbox
地址:Maps, geocoding, and navigation APIs & SDKs | Mapbox
Mapbox GL JS 是目前最新潮的前端地图库,它的矢量压缩、动态样式和三维性能令人印象深刻。它本身是开源的,但一般依赖于Mapbox公司提供的底图服务
优点:易于使用,提供丰富的组件和可视化工具;支持多种地图风格、图层和样式自定义。
缺点:付费的高级功能较为昂贵;需要 Mapbox 服务器 API。